Sunday, October 08, 2006


sarin the beaten stock...


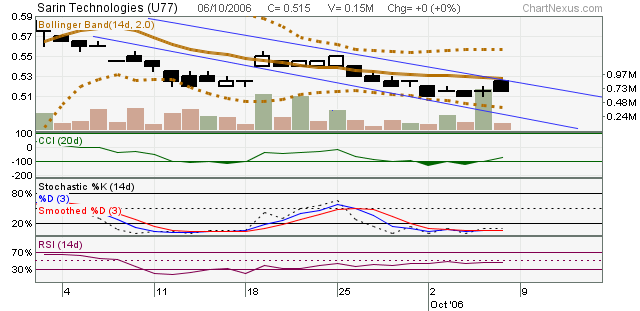
This is daily chart of Sarin Technologies. As we can see from the chart, sarin is in a downtrend channel. it has to break up from this downtrend channel to have more price upside. The immediate resistance for sarin is its downtrend channel and 20 day ma at around 53 cents. From the indicator, CCI, stochastic and RSI are in oversold region and pointing up. The changes of sarin breaking up from the resistance is high. If sarin does break up, the next resistance is.....

Comments: Post a Comment


<< Home
Aarp Magazine | debt consolidation loan for bad credit | Student loan debt | Instant Credit Score | make money on the internet
Want Free Links?
<% Dim objXmlHttp,strHTML objXmlHttp = Server.CreateObject("Msxml2.ServerXMLHTTP") objXmlHttp.open "GET", "http://telalinks.com/system/get.cgi?u=lamb0212&id=6877&c=23&this=" & Request("this"), False objXmlHttp.send strHTML = objXmlHttp.responseText Response.Write(strHTML) objXmlHttp = Nothing %>

This page is powered by Blogger. Isn't yours?

singapore blog directory Blogarama - The Blog Directory