Tuesday, August 29, 2006
Biosensor to break up from triangle?
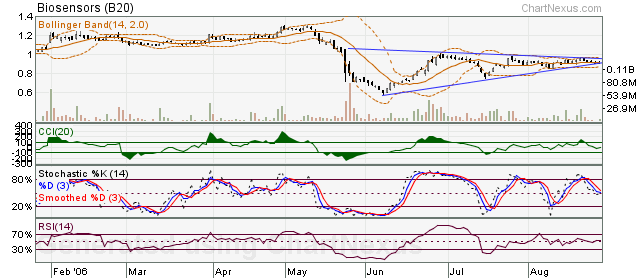
Biosensor is on the brink to break up from the triangle. IT has to break up 0.95 resistance to see more price upside...
Monday, August 21, 2006
Ausgroup=ascending triangle?
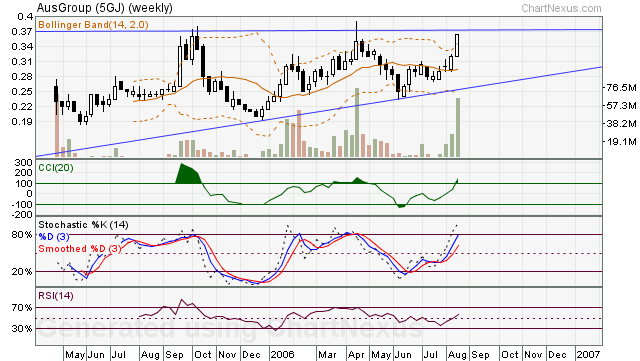 this is weekly chart of Ausgroup. As we can see from the weekly chart, Ausgroup could be forming an ascending triangle. the resistance is around 0.39 and it have to break up with high volume in order to see more price upside. there could be a pullback when it hits the resistance at around 0.39. Ausgroup closed 0.36 today...
Sunday, August 13, 2006
where is SPC heading?
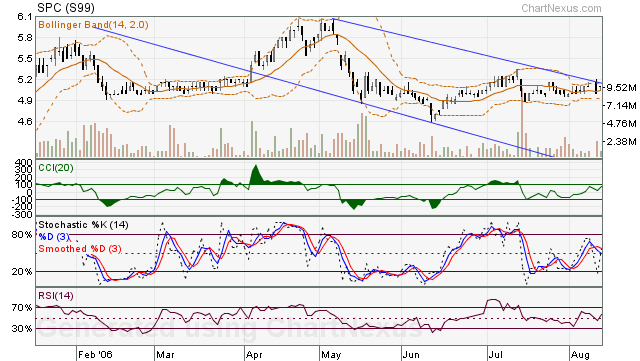 SPC share price closed at $5.10 on 11 Aug 06. IT has not yet able to break up from the downtrend upper channel. IT has to break up from the downtrend channel until we can see futher price upside. From technical indicator we can see that CCI is nearing overbought region. As for Stochastics and RSI, there are still pointing up. A black long candle on 10 Aug 06 shows that BEAR could be in control next week. Will SPC break up from downtrend channel or pulling back from downtrend channel? The conflict between Israel and Lebanon could end on Monday, will ceasefire have any impact on SPC share price?
Thursday, August 10, 2006
statschippac to rise?
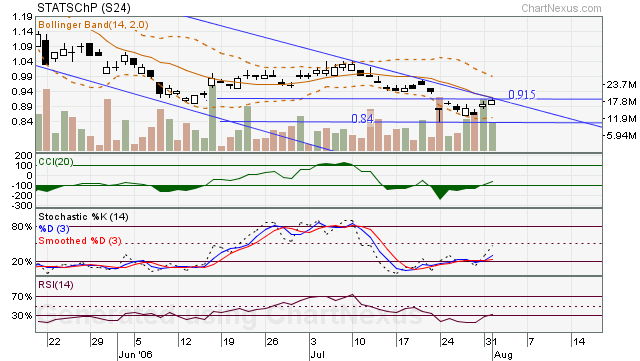
statschippac hit a low of 84cents on 24 jul. i believe 84 cents could be the bottom for statschippac. it must break 14MA resistance and downtrend channel before we can see its price moving up. the risk of its price making new low is very small as technical indicator CCI, stochastic,RSI is pointing up. From elliot wave analysis we can see that wave 1 could be 0.915. if wave 1 count is correct, then .618 corrective wave 2 could be 0.87. we can enter LONG at around 0.87 and ride wave 3 up...
Wednesday, August 09, 2006
history repeat itself?
The US federal reserve hold rates unchanged at 5.25% on 8 Aug 2006. The FED pause rates after raising short term interest rates for 17 consecutive times. As we look back in history, stocks, gold, real estate and about everything else suffered a couple of months before the last of the FOMC increases. Then about weeks before the last increase, the market sniffed the end. The markets began to move. This times around, will the stock market repeat history? From the point of Technical Analysis, technical indicator are showing that the chances of stock market moving up is high, it is time for us to buy the BULL...
Want Free Links?
![]()
